
Document compatibility determines how Internet Explorer renders your web page and how the JavaScript will work.
IE 8 and later will first determine how to render a page based on the X-UA-Compatible header which I'll discuss in a moment.
If the X-UA-Compatible header is not present, IE then looks for the DocType directive to determine how to render the page.
If the DocType directive is missing or does not specify a standards-based document type then the web page is rendered in IE 5 mode (Quirks mode of IE 7).
The recommended DocType in IE 9 is the HTML 5 DocType which will cause IE 9 to use Standards mode:
In my reading on the DocType directive I ran across an MSDN article that indicated that IE will also switch on Standards mode if the DocType includes a URI.
In my testing, including the URI in a DocType does appear to cause IE 9 to use Standards mode. Being able to use Standards mode even if the HTML is not HTML 5 allows us to make use of the latest JavaScript functionality in IE 9.
The following is an example of an HTML 4 DocType that causes IE 9 to use Standards mode:
If a web site does not work correctly in Standards mode it's recommended that the site be updated to use the most up-to-date features.
There are times, however, when you may want to force a web site to display using a specific document compatibility mode.
An example situation where you may want to force a web site to display using a specific document compatibility mode could be that perhaps you have a product that is live and you don't have time to upgrade it before people start using the latest IE browser.
There are several options available to cause IE to use a document compatibility mode other than IE 9 Standards mode.
The first option for changing the document compatibility mode is that an end user can click the Compatibility View button which will cause IE 9 to switch to IE 7 Standards mode.

(click to view the image full size)
The web site is listed in a Compatibility View list until the user removes the web site from the list by either clicking the Compatibility View button again or uses the Compatibility View Settings dialog.
You can find the Compatibility View Settings dialog by pressing Alt on your keyboard to show the menu bar and then select the Tools, Compatibility View settings menu item.
The Compatibility View Settings dialog allows the user to cause all Intranet sites, as well as all web sites, to use the Compatibility View setting by means of two checkboxes at the bottom of the dialog.

(click to view the image full size)
If the Compatibility View Settings checkboxes are checked, and you are viewing one of the respective types of web sites, you will not see the Compatibility View button in the address bar.
A temporary way to change the document compatibility mode of the browser is through the IE 9 Developer Tools.
You can display the Developer Tools by pressing F12.
Changing the selection of the Browser Mode or Document Mode drop-downs causes the web page to refresh and render according to the selected modes:
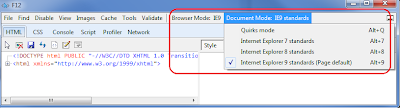
(click to view the image full size)
This technique is helpful if a developer wants to test how a web page renders in IE 9, IE 8, and IE 7 without having to switch to another computer since you can't install Internet Explorer versions side-by-side.
This saves a lot of time when trying to debug why something suddenly started breaking in IE 9 that didn't break in IE 8 for example.
In my testing so far, these settings appear to cause IE 9 to behave as expected but it's not a replacement to testing with the actual IE 7 and IE 8 browsers.
As a web developer you may decide that a page needs to be rendered using a certain document compatibility mode but only certain pages have this requirement.
You can include an X-UA-Compatible meta tag on one or more pages within the web site to tell IE how to render the page.
The meta tag needs to be the first tag in the Head section of a page following only the Title tag as in the following example:
Available values for the X-UA-Compatible setting are:
For a small web site simply dropping in the X-UA-Compatible meta tag is not a large task but if you have a web site with hundreds of pages, adding and maintaining the meta tags would be quite the task.
The better approach if you need to include the X-UA-Compatible value for an entire web site is to include the value as an HTTP Response Header
It is recommended that you always try to make sure your web pages work correctly in the latest versions of IE.
There are times, however, when you may need to temporarily tell Internet Explorer to display a page or website in a document mode used by a previous version of the browser which makes being able to specify the document compatibility modes a handy feature to have.
The following is a link to an MSDN article on Defining Document Compatibility if you would like to read more on the subject:http://msdn.microsoft.com/en-us/library/cc288325%28v=vs.85%29.aspx
IE 8 and later will first determine how to render a page based on the X-UA-Compatible header which I'll discuss in a moment.
If the X-UA-Compatible header is not present, IE then looks for the DocType directive to determine how to render the page.
If the DocType directive is missing or does not specify a standards-based document type then the web page is rendered in IE 5 mode (Quirks mode of IE 7).
The recommended DocType in IE 9 is the HTML 5 DocType which will cause IE 9 to use Standards mode:
<!DOCTYPE html>
In my reading on the DocType directive I ran across an MSDN article that indicated that IE will also switch on Standards mode if the DocType includes a URI.
In my testing, including the URI in a DocType does appear to cause IE 9 to use Standards mode. Being able to use Standards mode even if the HTML is not HTML 5 allows us to make use of the latest JavaScript functionality in IE 9.
The following is an example of an HTML 4 DocType that causes IE 9 to use Standards mode:
<!DOCTYPE HTML PUBLIC "-//W3C//DTD HTML 4.0 Transitional//EN" "http://www.w3.org/TR/html4/loose.dtd">
If a web site does not work correctly in Standards mode it's recommended that the site be updated to use the most up-to-date features.
There are times, however, when you may want to force a web site to display using a specific document compatibility mode.
An example situation where you may want to force a web site to display using a specific document compatibility mode could be that perhaps you have a product that is live and you don't have time to upgrade it before people start using the latest IE browser.
Even when a web site's JavaScript has been written to do feature detection for W3C compliant features and only fall back to IE specific features if the W3C feature is not available, IE 9 still throws some curve balls.
One curve ball that IE 9 throws is that, even in Standards mode, an MSXML ActiveX object is returned rather than a DOMParser object when making an XMLHttpRequest. The resulting XML document is incompatible with any XML documents that are created using the DOMParser.
The workaround is to return XML as text and turn the responseText value into an XML document object by using the DOMParser (the following MSDN article explains this process a bit more: http://blogs.msdn.com/b/ie/archive/2010/10/15/domparser-and-xmlserializer-in-ie9-beta.aspx).
There are several options available to cause IE to use a document compatibility mode other than IE 9 Standards mode.
Compatibility View button
The first option for changing the document compatibility mode is that an end user can click the Compatibility View button which will cause IE 9 to switch to IE 7 Standards mode.

(click to view the image full size)
The web site is listed in a Compatibility View list until the user removes the web site from the list by either clicking the Compatibility View button again or uses the Compatibility View Settings dialog.
You can find the Compatibility View Settings dialog by pressing Alt on your keyboard to show the menu bar and then select the Tools, Compatibility View settings menu item.
The Compatibility View Settings dialog allows the user to cause all Intranet sites, as well as all web sites, to use the Compatibility View setting by means of two checkboxes at the bottom of the dialog.

(click to view the image full size)
If the Compatibility View Settings checkboxes are checked, and you are viewing one of the respective types of web sites, you will not see the Compatibility View button in the address bar.
IE 9 Developer Tools
A temporary way to change the document compatibility mode of the browser is through the IE 9 Developer Tools.
You can display the Developer Tools by pressing F12.
Changing the selection of the Browser Mode or Document Mode drop-downs causes the web page to refresh and render according to the selected modes:

(click to view the image full size)
This technique is helpful if a developer wants to test how a web page renders in IE 9, IE 8, and IE 7 without having to switch to another computer since you can't install Internet Explorer versions side-by-side.
This saves a lot of time when trying to debug why something suddenly started breaking in IE 9 that didn't break in IE 8 for example.
In my testing so far, these settings appear to cause IE 9 to behave as expected but it's not a replacement to testing with the actual IE 7 and IE 8 browsers.
X-UA-Compatible meta tag
As a web developer you may decide that a page needs to be rendered using a certain document compatibility mode but only certain pages have this requirement.
You can include an X-UA-Compatible meta tag on one or more pages within the web site to tell IE how to render the page.
The meta tag needs to be the first tag in the Head section of a page following only the Title tag as in the following example:
<head>
<title>The Page Title</title>
<meta http-equiv="X-UA-Compatible" content="IE=8" />
</head>
<meta http-equiv="X-UA-Compatible" content="IE=8" />
Available values for the X-UA-Compatible setting are:
- 5 (renders as if IE 7 in Quirks mode which is very similar to how content was rendered in IE 5)
- 7, 8, and 9 (these ignore the DocType if present and display as if in Standards mode of the browser specified)
- EmulateIE7, EmulateIE8, EmulateIE9 (these take the DocType into consideration and displays using Standards mode or Quirks mode of the browser specified)
- Edge (this tells the browser to use the highest mode available and is not recommended in production environments)
The X-UA-Compatible value as an HTTP Response Header
For a small web site simply dropping in the X-UA-Compatible meta tag is not a large task but if you have a web site with hundreds of pages, adding and maintaining the meta tags would be quite the task.
The better approach if you need to include the X-UA-Compatible value for an entire web site is to include the value as an HTTP Response Header
In conclusion
It is recommended that you always try to make sure your web pages work correctly in the latest versions of IE.
There are times, however, when you may need to temporarily tell Internet Explorer to display a page or website in a document mode used by a previous version of the browser which makes being able to specify the document compatibility modes a handy feature to have.
The following is a link to an MSDN article on Defining Document Compatibility if you would like to read more on the subject:http://msdn.microsoft.com/en-us/library/cc288325%28v=vs.85%29.aspx


