
In this article we will discuss debugging JavaScript in Firefox by means of an add-on called Firebug (version 1.5.4).
If you need to debug JavaScript using Internet Explorer you can check out my blog post on using the Internet Explorer Developer Tools.
Aside from being able to debug JavaScript, Firebug also allows you to view HTML markup, CSS, inspect the DOM, monitor network requests, and much more.
For the purpose of this discussion we're only going to focus on the JavaScript debugging aspect of Firebug but I recommend exploring the other features in Firebug because many will prove useful in your day-to-day web development efforts.
Once you've installed the Firebug add-on there will be a small bug image in the status bar:

You can click on the bug image in the status bar to launch Firebug for the current window. You can also open Firebug by using the menu (Tools, Firebug, Open Firebug) or by pressing F12. The following is a screen shot of Firebug open in a window:

(click to view the image full size)
By default, Firebug opens as a pane at the bottom of which ever window had the focus. This is not always desired especially when trying to inspect a small pop-up window with limited space. You can open Firebug in its own window by using the menu (Tools, Firebug, Open Firebug in New Window) or by pressing Ctrl + F12.
The first time you launch Firebug, the information displayed will be the HTML markup of the page itself (the HTML tab). Since we wish to do JavaScript debugging, we need to switch to the Script tab as illustrated in the following image:

(click to view the image full size)
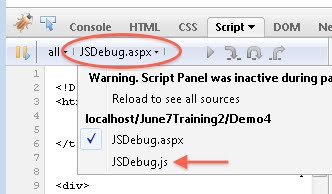
If you are following best practices for web development your JavaScript code should be located in a separate file. On the left pane's toolbar, in Firebug, is a drop-down menu that will show a list of all JavaScript files that are currently loaded for the page. Select the JavaScript file from the list that contains the code you wish to debug.
(click to view the image full size)
If you need to search the selected file for a particular item, you can do so by using the small search box in the top-right corner of Firebug:

(click to view the image full size)
Once you find the code that you wish to debug you can set a breakpoint by clicking in the margin or by right-clicking and choosing 'Set Breakpoint' from the context menu.

(click to view the image full size)
Note: Unlike Visual Studio and the Internet Explorer Developer Tools, you cannot set a breakpoint by pressing F9.
One nice thing about Firebug is that you don't have to tell it to start debugging. The next time the breakpoint is hit Firebug will take you to that line automatically.
The Firebug toolbar contains some buttons to help with the stepping into, over, and out of code. You can also use keyboard shortcuts rather than the toolbar buttons (Step Into is F11, Step Over is F10, and Step Out is Shift + F11).

(click to view the image full size)
Another nice feature of Firebug is that you don't need to add a variable to the Watch window to see its value. You can simply hover the mouse over the value and see a tooltip.
If you wish to add a variable to the Watch window you can do so by selecting the item, right-click on it, and then select 'Add Watch' from the context menu. You can also click in the watch window where the text 'New watch expression...' is and then type in the variable name.

(click to view the image full size)
And there you have it. Debugging JavaScript using the Firebug add-on within Firefox.
If you need to debug JavaScript using Internet Explorer you can check out my blog post on using the Internet Explorer Developer Tools.
Aside from being able to debug JavaScript, Firebug also allows you to view HTML markup, CSS, inspect the DOM, monitor network requests, and much more.
For the purpose of this discussion we're only going to focus on the JavaScript debugging aspect of Firebug but I recommend exploring the other features in Firebug because many will prove useful in your day-to-day web development efforts.
Once you've installed the Firebug add-on there will be a small bug image in the status bar:
You can click on the bug image in the status bar to launch Firebug for the current window. You can also open Firebug by using the menu (Tools, Firebug, Open Firebug) or by pressing F12. The following is a screen shot of Firebug open in a window:

(click to view the image full size)
By default, Firebug opens as a pane at the bottom of which ever window had the focus. This is not always desired especially when trying to inspect a small pop-up window with limited space. You can open Firebug in its own window by using the menu (Tools, Firebug, Open Firebug in New Window) or by pressing Ctrl + F12.
The first time you launch Firebug, the information displayed will be the HTML markup of the page itself (the HTML tab). Since we wish to do JavaScript debugging, we need to switch to the Script tab as illustrated in the following image:

(click to view the image full size)
If you are following best practices for web development your JavaScript code should be located in a separate file. On the left pane's toolbar, in Firebug, is a drop-down menu that will show a list of all JavaScript files that are currently loaded for the page. Select the JavaScript file from the list that contains the code you wish to debug.

(click to view the image full size)
If you need to search the selected file for a particular item, you can do so by using the small search box in the top-right corner of Firebug:

(click to view the image full size)
Once you find the code that you wish to debug you can set a breakpoint by clicking in the margin or by right-clicking and choosing 'Set Breakpoint' from the context menu.

(click to view the image full size)
Note: Unlike Visual Studio and the Internet Explorer Developer Tools, you cannot set a breakpoint by pressing F9.
One nice thing about Firebug is that you don't have to tell it to start debugging. The next time the breakpoint is hit Firebug will take you to that line automatically.
The Firebug toolbar contains some buttons to help with the stepping into, over, and out of code. You can also use keyboard shortcuts rather than the toolbar buttons (Step Into is F11, Step Over is F10, and Step Out is Shift + F11).

(click to view the image full size)
Another nice feature of Firebug is that you don't need to add a variable to the Watch window to see its value. You can simply hover the mouse over the value and see a tooltip.
If you wish to add a variable to the Watch window you can do so by selecting the item, right-click on it, and then select 'Add Watch' from the context menu. You can also click in the watch window where the text 'New watch expression...' is and then type in the variable name.

(click to view the image full size)
And there you have it. Debugging JavaScript using the Firebug add-on within Firefox.
No comments:
Post a Comment